
One of the criticisms that i2P has leveled at pharmacy proprietors/managers and their leadership body, the Pharmacy Guild of Australia is their style of management.
It has always been a top down hierarchical style that is slow-moving and now out of date.
It concentrates excessive power at the executive end of the organisation, with members finding themselves totally reliant on the Guild to move in any direction.
It is also one of the reasons that pharmacy finds itself stuck in a business model that is now redundant simply because members tend to wait until the PGA solves every problem for them or tells them what to do next.
Where is the enterprise spirit in that?
i2P has been delivering a steady flow of ideas and management strategies in the belief that some of these items will germinate in one or more pharmacies, to bring new life.
We can see a slow adoption of some ideas, but an acceleration in energy is required to generate a momentum of real, visible change.
And here is another new paradigm idea – turn the traditional management organisation chart upside-down to view it from a customer perspective.
That single idea would start your new paradigm pharmacy hurtling in the right direction immediately.
And it is cost effective.
Believe it or not, the first business organisation chart for a business was developed by Scottish engineer Daniel McCallum in 1854, so one could be forgiven for asking why there have been so few variants produced since that date?
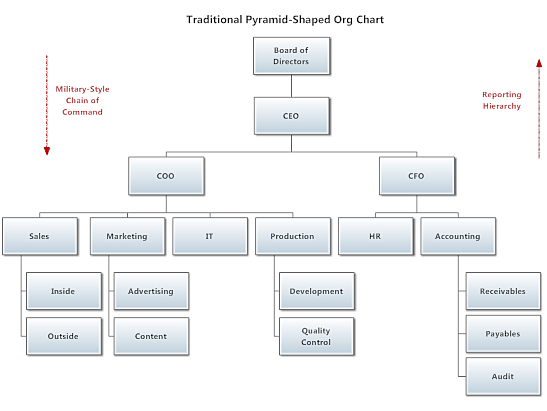
But McCallum’s chart was not the top-down, pyramid-shaped design to which we’ve become accustomed to.
That was later developed by Alfred Chandler, a Harvard professor.
Chandler advocated a top-down hierarchical approach that consolidated power and control in top management.
It looked something like this:
 Interestingly enough, McCallum’s organisation charts were created to combat a new issue facing management: too much information.
According to an article by Caitlin Rosenthal published in McKinsey Quarterly, the growing use of the telegraph ushered in a new era of “big data.”
For management, trying to capture this information, process it into decisions, and get it into the right hands in the field proved an immense task.
It seems as though the wheel has turned a full circle because information management has again become a very big issue today’s IT environment.
Turning Management’s Thinking Upside Down
McCallum knew that 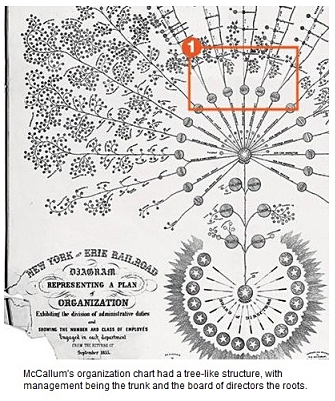 trying to move this new mountain of data up and down a chain of command was inefficient.
So he devised a new strategy: delegation of power at the local levels.
The organization chart he developed took on the structure of a tree:
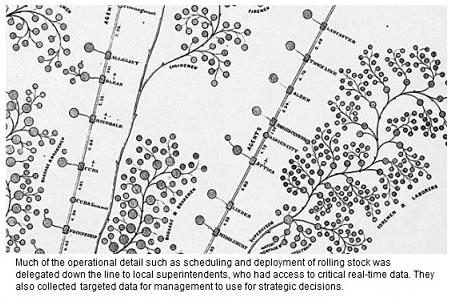
McCallum knew that the supervisors here were nearer the action, had the most up-to-date information, and were best suited to make timely decisions.
But McCallum’s goal was not simply to decentralize everyday tasks and empower line supervisors to make real-time operating decisions.
He also set forth a plan whereby they collected relevant statistics on a timely basis, such as cost per ton-mile and load per car.
These were then delivered to upper management for use in analyzing business strategy and finding opportunities to improve results.
Here’s a more detailed view of McCallum’s organisation chart.
 Companies like Apple and Google have experimented with various forms of organisation – and they have been spectacularly successful.
Why?
These unconventional organisational formats have encouraged innovation, experimentation, and a high level of trust in their staff.
This is definitely not Australian pharmacy in the 21st century which is still promoting a tired and distant pharmacist manager/owner separated from customers, patients and staff by the torrent of PBS scripts, churning up time that is wasted on government regulations rather than customer satisfaction.
Customers are disappointed.
They still want their pharmacist but find access is difficult.
Why is this so?
Organisation charts are a useful tool to show relationships, perspectives and functions.
Their value lies in that it gives a visual and a representative snapshot of the entire organisation and can illustrate the need for divestment into smaller, more manageable units when size becomes difficult to manage.
Staff will find it easier to visualise their responsibilities and their position in an organisation when they can view such a chart.
There is no official format for an organisational chart, but the pyramid-shaped version has become fairly standardised.
In the 1920s a survey revealed that organizational charts were still not common among ordinary business concerns, but they were beginning to find their way into administrative and business enterprises.
The term “organigram” or “organigraph” originated in the 1960s.
These attempted to introduce relationship, design and style.
As a management consultant to a new client, the first thing that I would do after being retained by a client was visit the pharmacy and, with permission, interview every single staff person within the premises.
I would introduce myself and allay any fears about change that might affect them.
At the same time I would ask them all, irrespective of position, the following question:
“If you had the power and the budget what would be the first things that you would change to make the pharmacy a better workplace and a more welcoming environment for customers?”
I never failed to get an answer, even from the after-school delivery boy.
I would then propose to them that I would try to persuade management to adopt their ideas as a unified whole with other staff suggestions.
So I got their collective agreement for change that they owned, and I also got an insight into what gaps existed in that pharmacy’s business matrix.
Change from the bottom up!
There are several limitations of organizational charts.
If updated manually, organizational charts can very quickly become out-of-date, especially in large organisations that change their staff regularly.
They only show “formal relationships” and tell nothing of the pattern of human (social) relationships which develop.
They also often do not show horizontal relationships.
They provide little information about the managerial style adopted (e.g autocratic, democratic or an intermediate style)
In some cases, an organigraph may be more appropriate, particularly if one wants to show non-linear, non-hierarchical relationships in an organization.
They often do not include customers.
One of the most successful models of an inverted pyramid organisational structure is the Nordstrom business model.
Nordstrom Inverts the Organizational Pyramid
Many organizations have long understood the need to put decision-making power in the hands of their people on the front lines.
Upscale retailer Nordstrom is well-recognized for this practice. In fact, during the orientation of their newly hired associates, Nordstrom management gives them just a few basic instructions. One is to instill their hierarchy of importance, with customers at the top. This is shown in the sales funnel chart below.
Directly below customers i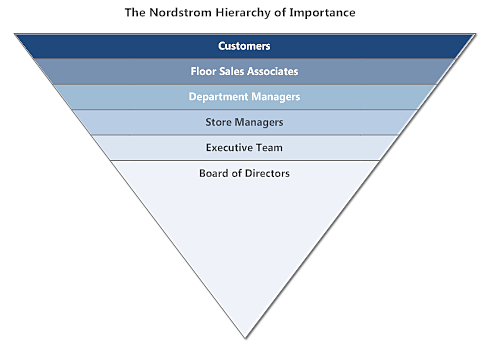 s the floor sales staff. Why? Because they are the ones who deal with the company’s most important people-customers-every minute of every day.
As a result, Nordstrom management gives these people authority to make customers happy with their shopping experience. New sales associates are told to follow one simple rule: use your best judgment. (They are also told that one of the reasons they were hired was that they met Nordstrom’s exacting demands in this area.)
This approach has clearly served the company extremely well from a customer relations standpoint.
An idea of their management style is found in their employee handbook.
For many years, new employees were given a copy of the Nordstrom’s Employee Handbook – a single 5-by-8-inch (130 mm × 200 mm) gray card containing 75 words:
Welcome to Nordstrom
We’re glad to have you with our Company.
Our number one goal is to provide outstanding customer service.
Set both your personal and professional goals high. We have great confidence in your ability to achieve them.
Nordstrom Rules: Rule #1:
Use best judgment in all situations.
There will be no additional rules.
Please feel free to ask your department manager, store manager, or division general manager any question at any time.
What the company had introduced was a mentoring style of management where everyone was, more or less, left to their own devices and allowed to get on with what they saw their job to be.
Any uncertainty was eliminated because individuals were given uncluttered access to senior management in a non-threatening way.
Of course, they were also free to ask their co-workers before moving up the chain of command.
When introducing this style of management in any client environment I would always ask all employees to frame their questions so that they could be answered with a simple yes or no.
They always got more than a one-word answer because having done their homework in carefully phrasing their questions, an intelligent listener could not help themselves, by adding to their response a host of suggestions and alternatives based on their own experiences.
Here you have the epicentre of a continual learning experience that equates to mentoring. Everyone must adopt this style of questioning for overall success.
Today, the same handbook provided to new employees has further streamlined the company’s “One Rule” to:
“Use good judgment in all situations.”
Recognition
* Nordstrom was listed at No. 72 in Fortune magazine’s 100 Best Companies to Work For 2009.[34] (Nordstrom is a Hall of Fame member of Fortune magazine’s “100 Best Companies to Work For” list.[35])
* Nordstrom was No. 36 on the same list in 2008, No. 24 in 2007, No. 46 in 2006 and No. 88 in 2005.[36]
* In 2010, it ranked number 53, and dropped to 61 in 2012.[37]
* Nordstrom was ranked No. 286 (previously 293) on the Fortune 500 for 2007.[38]
* In 2011 it ranked 254,[39] and as of 2012 it sits at 242.[40]
* As of December 2013, WWD reports that Nordstrom is the top fashion retailer.[41]
Making the Old Org Chart New Again – Re-Inventing Pharmacy
The “big data” issue has come full circle in the 160 years since McCallum designed his first org chart. Maybe it’s time to rethink things and re-examine the applicability of a more decentralized structure.
Many organizations already operate this way, or at least in a manner that isn’t a rigid as the “command and control” pyramid. Perhaps, then, it just makes sense to put our view of the organization into a more practical visual structure.
Here’s a rethinking of the traditional organization chart that was presented at the beginning of this article:
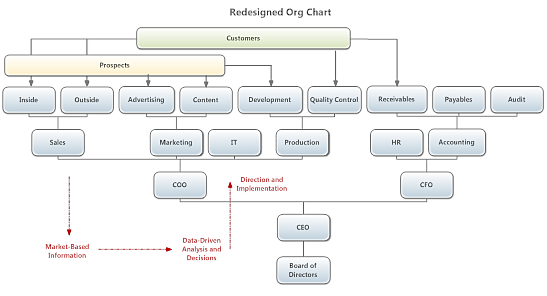 While this illustration is a generic version of an organisational chart it is not too difficult to illustrate the duality of pharmacy (customers and patients) and illustrate an independent relationship for patients and clinical services.
You may prefer to do a separate organisational chart for patients and clinical services before amalgamating as a whole.
That approach I would recommend.
This will form the subject of a future article, but it should not deter pharmacists from trying their hand at an organisational chart of management design.