
Given the opportunity to start with a clean slate, a blank sheet of paper and be unencumbered with tradition, what would a new model for pharmacy look like?
In the previous article, we looked at (i) The Service Continuum and (ii) competitive advantage theory to create an initial macro path forward.
We summarized that a new pharmacy model should:
-
NEVER take the low ground in terms of mass and momentum unless you can afford to take on all comers – that includes the supermarkets;
-
It’s better to take the high ground and convey a core proposition and message to potential customers in everything you do, everyday;
-
Work with a targeted cohort of customers and provide services or products that provide a superior outcome and that are uncommon in the marketplace;
-
The pharmacist, what he does and the value that he brings must be the brand and this must enable the conversion of time into money by its very definition.
So this all sounds fair, so what IS the opportunity?
The Value Curve
A value curve is simply a plot of the intrinsic product & service elements of a business on an x axis vs the relative strength of that element in the y-axis. The value curve is a powerful tool for pin-pointing similarities between business offerings and identifying potential points of difference or ‘blue oceans’ that can be exploited. By plotting a value curve, businesses have 4 options to create opportunity:
1. Reduce – identify which factors can be reduced below an industry standard and leverage this value
2. Create – identify which factors should be created that have never been offered and leverage this value
3. Raise – identify which factors can be raised above an industry standard and leverage this value
4. Eliminate – identify which industry factors should be eliminated and leverage this value.
Some time ago, I surveyed 10 mums in a focus group to plot the value curves of 6 main-stream Australian pharmacy banner groups. That value curve is shown below with the average rounded value plotted. The following elements were plotted with a rating of 1 (poor) to 5 (high):
-
Price – respondent felt like they paid the lowest price available
-
Access to professional advice – ease of getting advice and its quality
-
Brand – the banner has a proposition or promise and delivers it
-
Range – the widest range wins
-
Ease of shopping – wide aisles, custom neon signs, good lighting, look & feel
-
Better health outcome – shopping here was better for your health compared to others
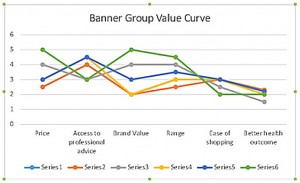
To avoid the likely controversy, I won’t identify the banners except to say that plot 6 (green) was Chemist Warehouse. I will tell you that the others banners were Amcal, Guardian, Priceline, Chemart and Terry White. To be fair to the stakeholders, a sample size of 10 is not particularly large and this focus group was held in 2009, but I doubt much has changed.
As you can see, the value curves had many similarities but also made several important points. Commenting of the results I found with Chemist warehouse (curve 6):
-
the mums unequivocally understood its USP from its name, advertising and branding, and from further questioning during the focus group, the highly stacked and somewhat cluttered range of products and plethora of price tickets gave the impression of genuine savings off RRP. This brand makes a promise (whether you like it or not) and the stores deliver it;
-
Even though it scored highly in terms of range it also scored the lowest in ease of shopping – interesting. The mums didn’t want access to all products, just the right product;
-
all other scores were in-line with the other groups.
By exception and a point raised by the Mums, the majority of other pharmacy banners lacked a proposition – the mums could not identify what the other banners were promising to them or articulate what the value of the banner brands was supposed to be. One other group did score well in terms of having a strong proposition, but when I asked what it was, there was inconsistency on what the promise was.
But here is the main point. There is a big gap on that curve above. Not one mum, and I mean not one, could identify that shopping in one banner vs another was better for their health. The implication of having the same PBS products, same OTC products, same core ‘pharmacist’ value meant that no one had leveraged a proposition of discernable difference in health outcome to the consumer.
For pharmacy, this is the blue sky – provide products or solutions which are tailored and personalized. Don’t give them any product – give them their product. This is the space which is unoccupied in pharmacy (in contrast to the promise of range or price) and this correlates perfectly with the previous article on The Service Continuum, where in the pharmacy space, the right hand side is currently vacant and where no pharmacy offer has been able to leverage a real value in the consumers eyes which is consistently worth paying for. The sixty four thousand dollar question, is ‘How’
Stay tuned for Article 3 – Taking back the margin and turning time into money